Phishing sites impersonated the social media industry more than any other in Q2, Q3, and Q4 of 2023. In Q4 alone, social media phish leapt nearly 20%, reaching the highest volume of abuse (over 67%) since Fortra has reported on this data point.
Every quarter, Fortra’s PhishLabs examines hundreds of thousands of phishing attacks targeting enterprises and their brands. In this post, we break down the latest phishing activity, staging methods, and top-level domain abuse.
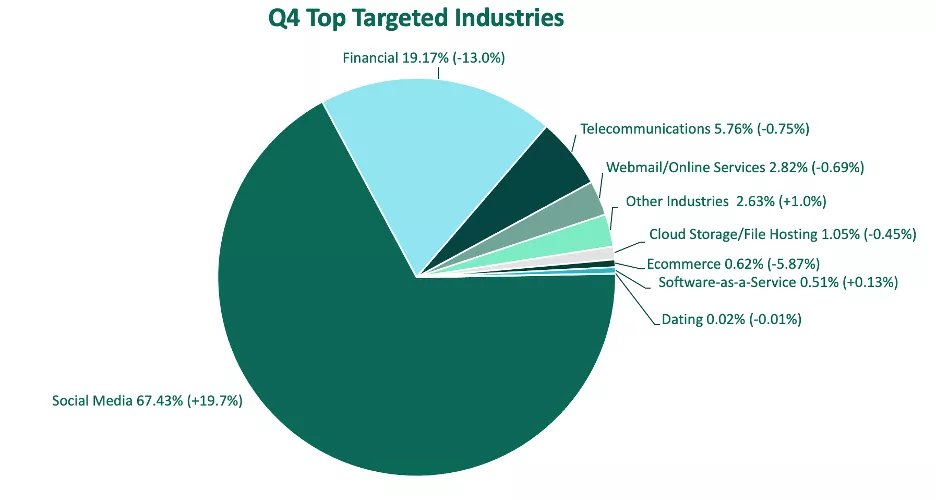
In Q4, phishing volume fluctuated widely between financial institutions and social media, creating a nearly 50% gap in volume between the two industries. While the number of phishing sites targeting social platforms have historically followed behind financials, this is the third consecutive quarter threat actors have focused their efforts on the social industry. This could indicate a growing interest in capturing sensitive information by means of online spaces not typically associated with security risks (i.e. such as bank account portals, credit card logins).
Phishing sites impersonating financial institutions dropped to their lowest recorded share of volume in Q4, with under 20% of activity. The number of phish targeting financials declined steadily quarter-over-quarter in 2023, save for a nominal increase from Q2-Q3, which still found the industry less targeted than social media.
Although they experienced a slight decline in share in Q4, telecommunications were the third most impersonated industry by threat actors. Telecoms declined 0.75% from Q3, making up just under 6% of overall phishing volume.
Other industries targeted include:
- Webmail/Online Services 2.82% (-0.69%)
- Other Industries 2.63% (+1.0%)
- Cloud Storage/File Hosting 1.05% (-0.45%)
- Ecommerce 0.62% (-5.87%)
- Software-as-a-Service 0.51% (+0.13%)
- Dating 0.02% (-0.01%)
Phishing Sites Targeting Financials
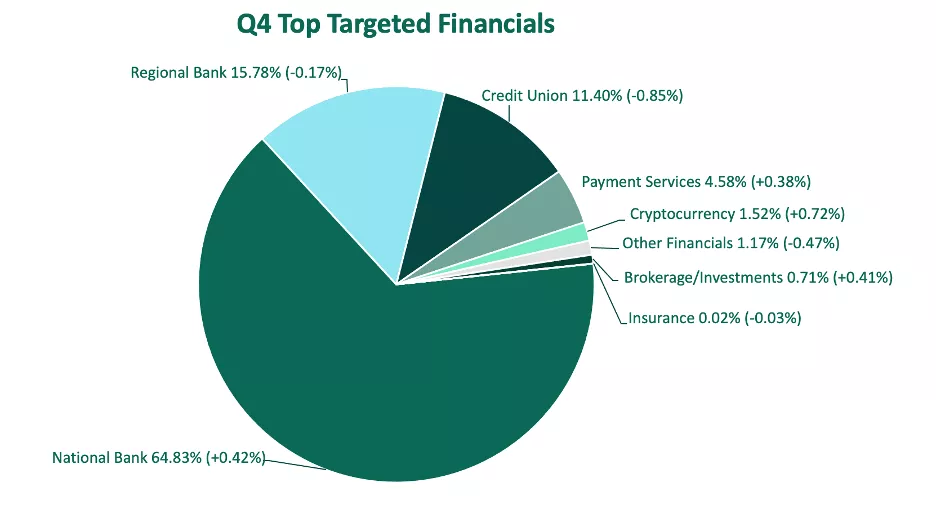
The financial industry saw minor fluctuations in activity in Q4, with national banks retaining their spot as the most impersonated group. National banks were targeted slightly more (0.42%) over Q3, contributing to 64.83% of all financially-focused phishing sites.
Regional banks were targeted nearly 16% of the time in Q4, after a nominal decline over the previous quarter. Regional banks have been the second most targeted subcategory for two quarters in a row, overcoming previously favored credit unions. Credit unions remained the third most impersonated group in Q4, with 11.4% of share of volume.
Other targeted financials include:
- Payment Services 4.58% (+0.38%)
- Cryptocurrency 1.52% (+0.72%)
- Other Financials 1.17% (-0.47%)
- Brokerage/Investments 0.71% (+0.41%)
- Insurance 0.02% (-0.03%)
Staging Methods
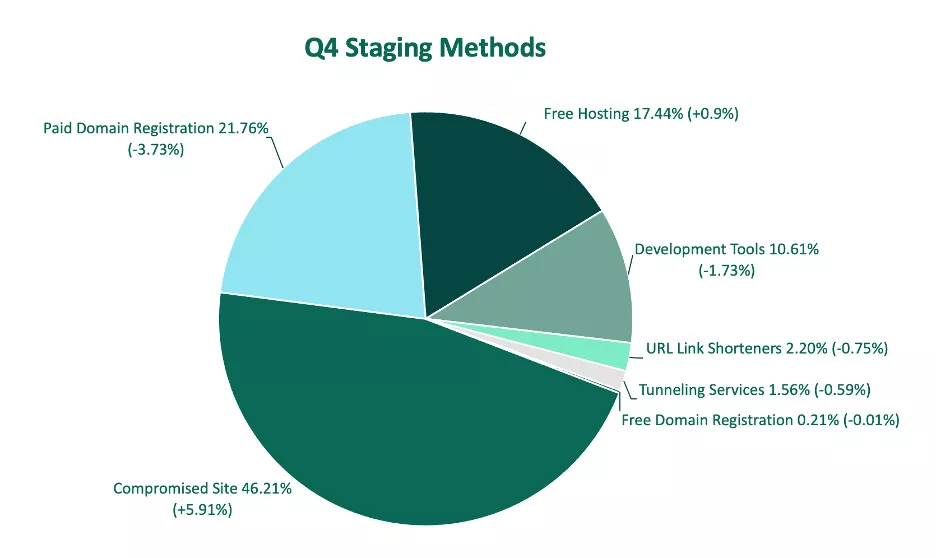
In Q4, more than 78% of phishing sites were staged using no-cost methods (i.e. free services or by compromising an existing site.) This is a more than 12% increase over Q3, and the greatest recorded volume since reporting on this data point.
The greatest contributor to the increase can be linked to a growing number of phishing sites being staged through the exploitation of a legitimate site. While compromised sites traditionally make up the majority of phish, the share of volume of compromised sites increased nearly 6% in Q4, representing the most significant jump in two years.
Paid domain registrations were the second most popular method of staging phishing sites in Q4, despite experiencing a decrease of 3.7%. Paid domains made up more than 21% of staging volume.
Free hosting was the only other category to see an increase in activity over the previous quarter, growing to 17.4% of total staging volume.
All other categories saw minor declines in Q4 and contributed to the following volume:
- URL Link Shorteners 2.20% (-0.75%)
- Tunneling Services 1.56% (-0.59%)
- Free Domain Registration 0.21% (-0.01%)
Top-Level Domain Abuse
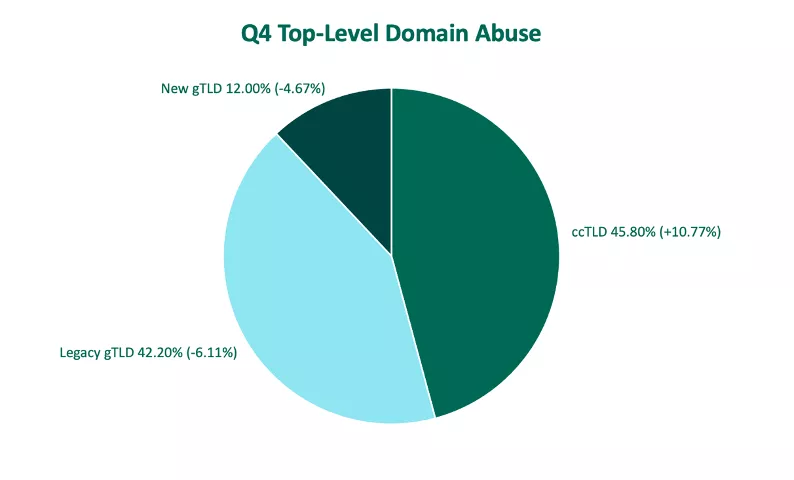
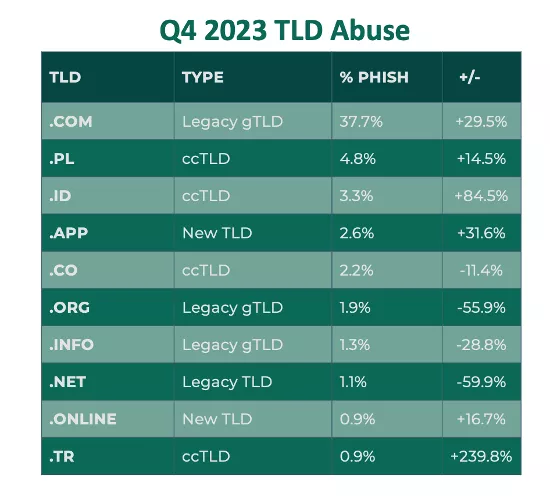
Threat actors were most prone to using country-code TLDs (ccTLDs) in Q4, after a nearly 11% QoQ increase put the category ahead of historical leader Legacy gTLDs. ccTLDs have only led TLDs in abuse twice since Fortra’s reporting on this data, with both instances occurring in 2023.
Other ccTLD insights include:
- There were four ccTLDs within the top ten: .pl, .id, .co, and .tr.
- ccTLD .pl moved from the third most abused TLD in Q3 to the second in Q4.
- .co was the only ccTLD to see a decline.
Newcomer to the top ten .tr made up just under 1% of total volume, after a significant 239.8% increase in abuse over Q3.
Despite Legacy gTLDs being abused less as a whole, .com remained the TLD most exploited by threat actors. Legacy .com made up 37.7% of TLD volume and increased just under 30% from last quarter. All three other Legacy gTLDs that made it to the top ten (.org, .info, and .net) experienced QoQ declines.
There were two New TLDs that made it to the top ten in Q4, .app and .online. New TLD .app was the fourth most abused and .online was the ninth. Both increased in volume over Q3.
In Q4, social media proved to once again be the industry of choice for threat actors targeting victims with phishing attacks. While the tactics used to create these malicious sites varied, criminal preference to no-cost staging methods and ccTLDs stood out as top elements to attacks. Recognizing the variables attributed to phishing activity is key to early detection and a critical component to mitigate threats targeting your brand.
Fortra can help your organization combat phishing attacks.
